Looking for information on Avalanche’s (AVAX) emission schedule? Finding it online is next to impossible, so we investigated and made some calculations.
Historical Overview
AVAX launched in September 2020 as a Layer 1 protocol, debuting at a price slightly above $5 before dropping to a little more than $3. It peaked in November 2021 above $134 before falling back to Earth, sitting at about $20 as of July 2022. The project minted 360 million AVAX tokens at its inception with vesting periods ranging from one to 10 years.
Ava Labs — headquartered in Brooklyn, New York, and led by Cornell Professor Emin Gun Sirer — serves as the network’s developer. And because the chain allows developers to use subnets — their own blockchains — it has attracted an influx of projects over the last year, making it one of the top 20 cryptocurrencies by market capitalization.
July 2022 Circulation: 283 Million
Snowtrace, the chain’s explorer, reported 283,634,00 AVAX tokens in circulation as of July 15, 2022.
According to Messari estimates — which aren’t quite correct, but do provide a baseline for calculation — circulation should reach 600 million by July 12, 2027. That will constitute a little more than 83 percent of AVAX’s hard cap of 720 million.
July 2027 Circulation: 600 Million
The change constitutes an increase of 317 million tokens, an expansion of about 112 percent over five years. The influx will not be linear: Messari projects supply at 381 million in July 2023 — an increase of 98 million — and 457 million in 2024, a rise of 76 million. That’s followed by an additional 53 million from 2024-25 (for a total of 510 million), and 45 million in both 2026 (a total of 555 million) and 2027. Supply should reach 600 million in July 2027.
In the short-term, that amounts to a 34 percent increase between 2022-23, or about 2.8 percent monthly.
RELATED: How to Bridge Tokens to Avalanche (AVAX)
AVAX Burned: Daily Average of 3,326
Avalanche “burns” transaction fees, taking the tokens paid by those who transact on the network and eliminating them from circulation. Snowtrace offers an explorer where you can view the historical record of tokens burned each day dating back to Sept. 24, 2020, while BurnedAvax tracks the overall tally. As of July 15, 2022, the bottom-line number stood at 1,879,611. (May 11 of this year set the record with 29,511 tokens burned.) That means a daily average of 3,326 tokens have been removed from circulation in the 565 days since tracking began.

The numbers mean an average burn rate of 1,213,990 tokens each year, worth 4.2 percent of the supply as of July 2022. In the event that more projects move to the network, transaction fees will increase due to heightened traffic, making it possible the burn rate will rise in the future.
RELATED: Safemoon’s ‘Reflection’ Tokenomics: Legitimate or a ‘Slow Rug Pull’?
AVAX Price Estimates
If you’d like to calculate what the numbers mean for the future price of AVAX, you can do so if you come up with a projection for its market capitalization. Token price is equal to market cap divided by number of tokens in circulation.
On that note, Avalanche’s market cap peaked at $30 billion in November when its token price was $134. It declined to $5.6 billion as of July 15, when the token price was $20.
In terms of circulating supply, we can deduct 1.2 million burned tokens from total AVAX supply projected for July 2023 to reach an estimate of 379.8 million tokens. If we deduct 6 million burned tokens from the supply projected for July 2027, we can assume 594 million in circulation.
After crunching the numbers, we find what the price would look like under either market cap in both years.
2023 at $30 Billion:$78.98
2023 at $5.6 Billion: $14.74
2027 at $30 Billion: $50.50
2023 at $5.6 Billion: $9.42
In order for AVAX to return to its previous all-time high price of $134 with 379.8 million tokens in circulation, market cap will need to reach $50.9 billion. With 594 million tokens in circulation, that number is $79.6 billion. (For perspective, as of July 15, bitcoin’s market cap was $394 billion. Ethereum came in second, at $143 billion. Tether placed third, at $65 billion.)
RELATED: Here’s the Unlocking Schedule for DeFi Kingdoms’ JEWEL
Chart Comparing Emissions
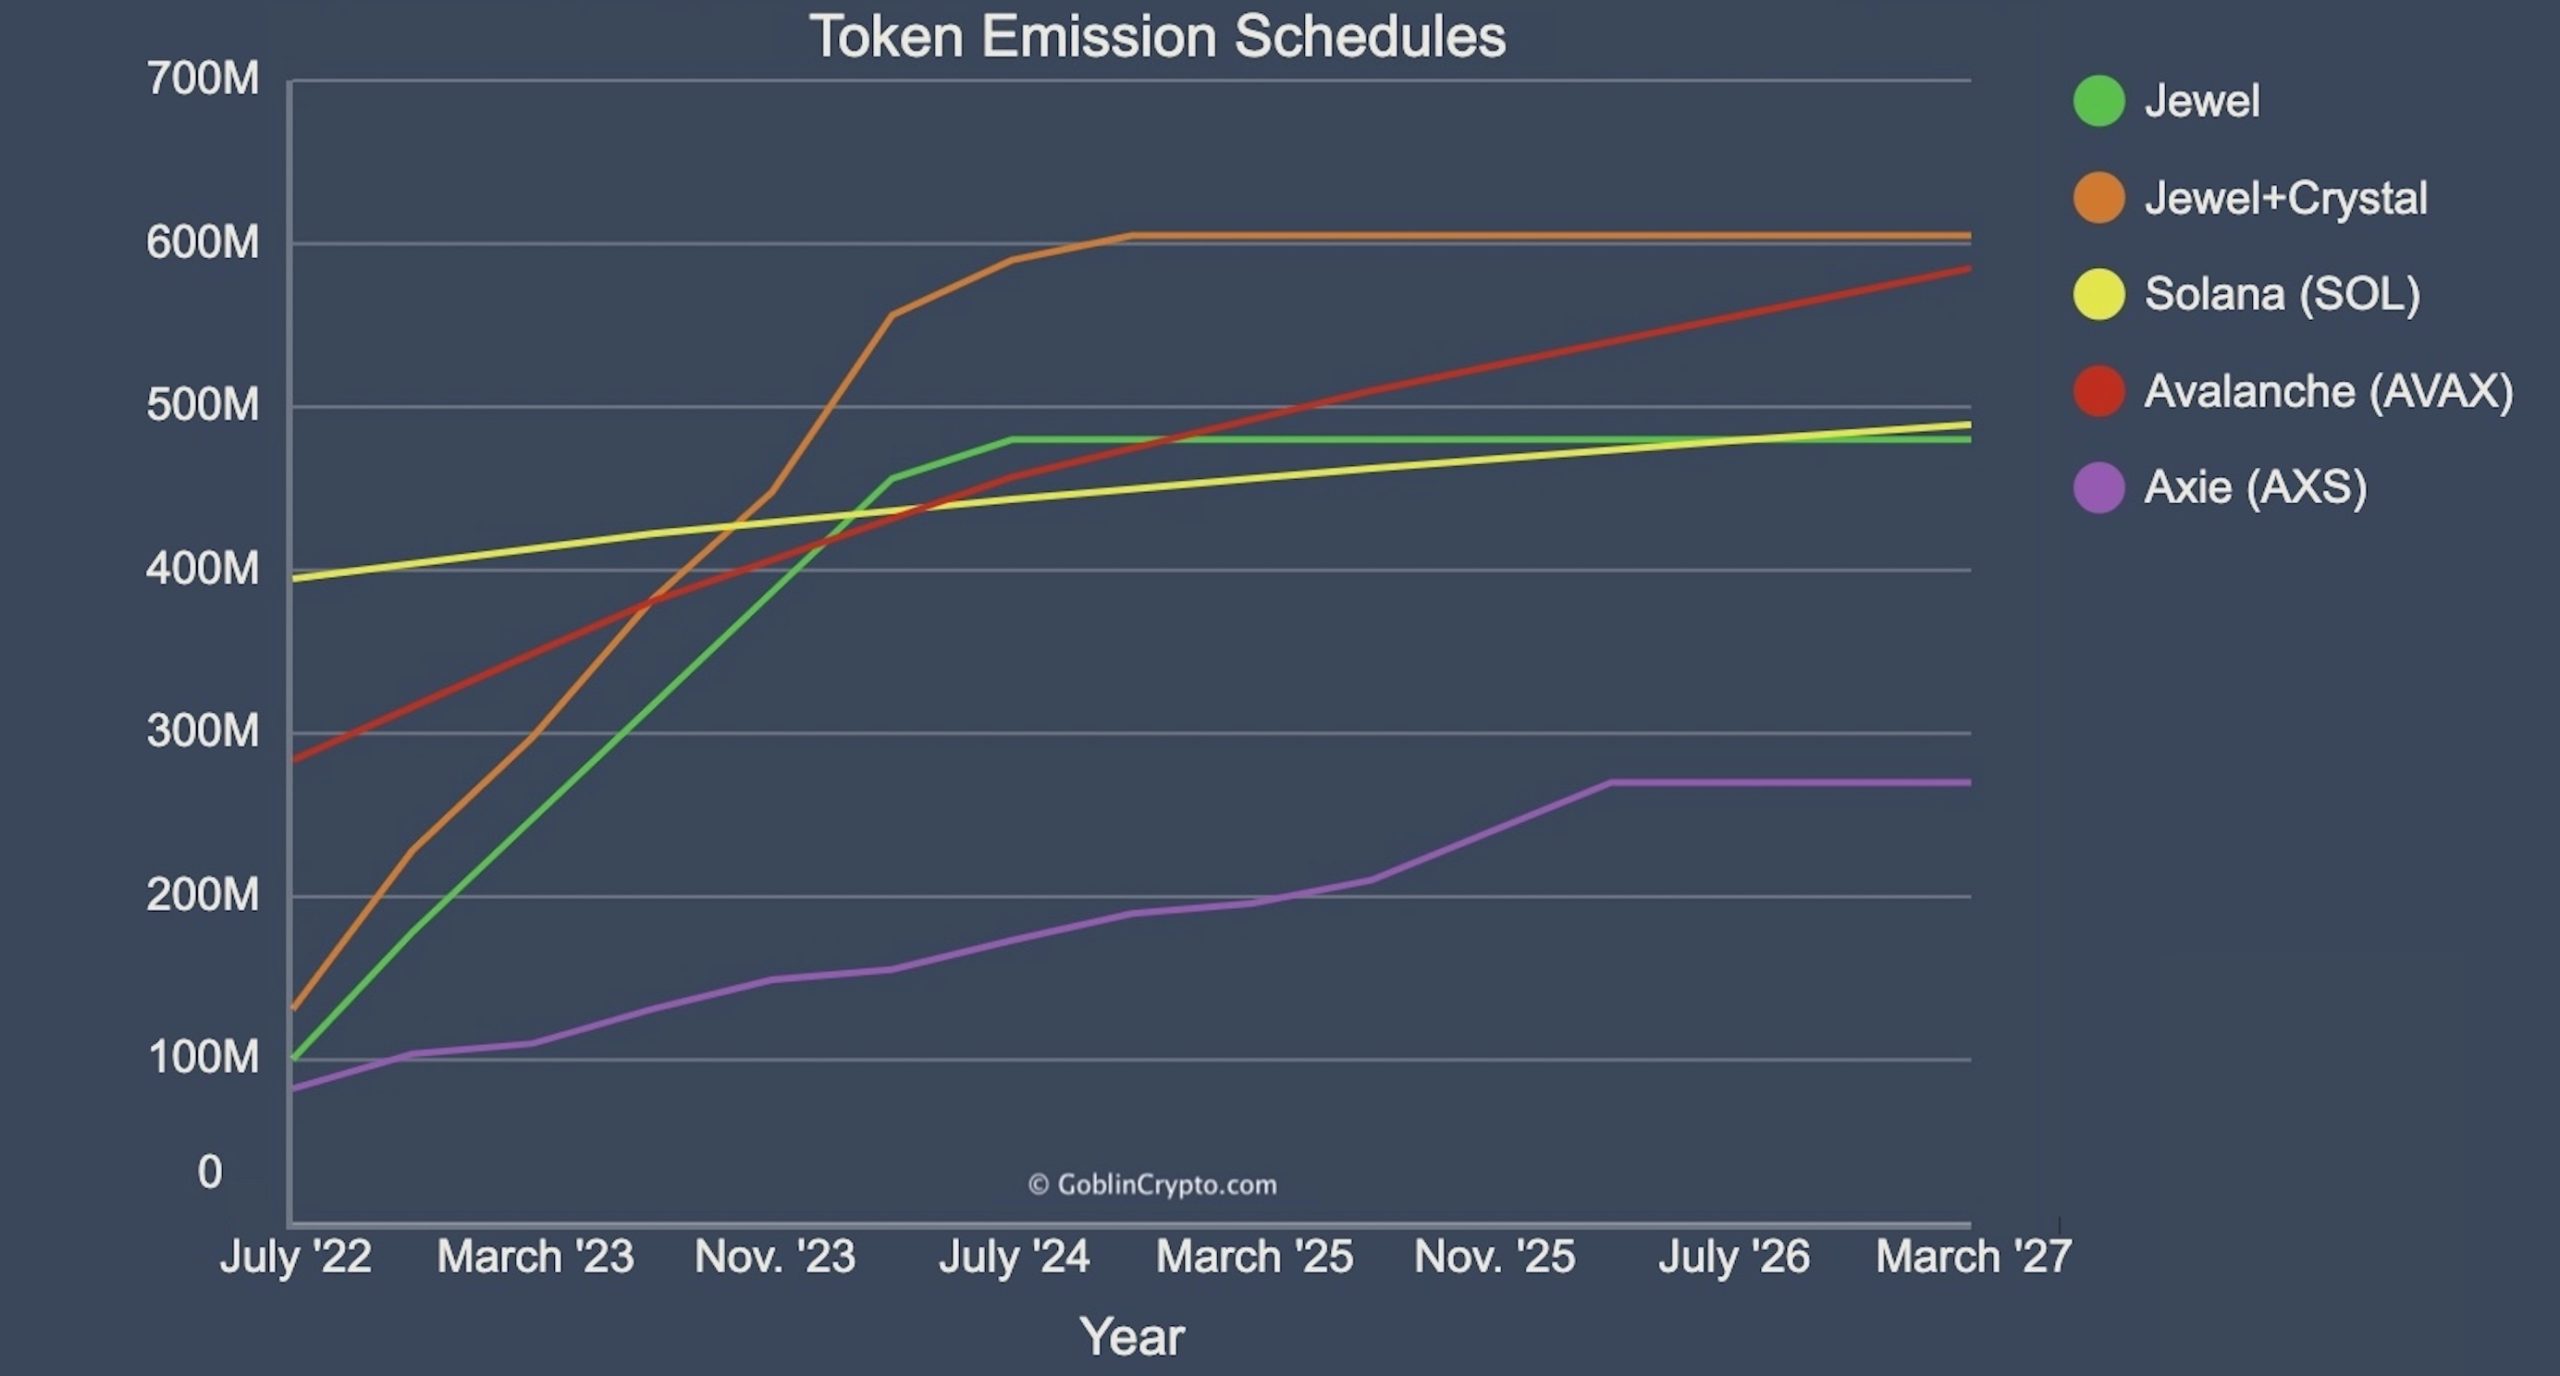
This is what the emission schedule for AVAX looks like compared to the emission schedule for Solana, as well as the schedules for GameFi tokens offered by Axie Infinity and DeFi Kingdoms.

RELATED: Solana’s Emission Schedule: Expect Supply to Increase 43% Over the Next 5 Years
Closing Caveats
There are variables that will affect AVAX’s rate of inflation. The top variable is the number of tokens distributed as staking rewards. Those account for the bulk of growth in upcoming years. Of 317 million tokens scheduled to hit the market between 2022 and 2017, 192 million will come from staking payments — or 60 percent. Avalanche allows validators to set the reward rate through governance. (Validators are required to stake 2,000 AVAX for time periods ranging from two weeks to one year. As of July 15, the network had 1,293 validators.)
“This will allow token holders to choose the rate at which AVAX reaches its capped supply,” developers note in the project’s tokenomics white paper. They also chart out distribution rates under two different scenarios — one in which 100 percent of tokens are staked (resulting in more rapid inflation), and one in which only 50 percent are staked. Fifty-seven percent of tokens were staked as of July 2022, setting inflation up to track with the more gradual schedule.
If you’d like to read the white paper — and enjoy advanced math — you can find it embedded above.

 Bitcoin
  Ethereum
  Tether
  XRP
XRP  Solana
  Dogecoin
  Cardano
  Chainlink
  Avalanche
  Polkadot
  Monero
  Cronos
  Aave
Aave  Algorand
  Tezos
Tezos  Axie Infinity
  Polygon
  Onyxcoin
  Golem
Golem  Flux
Flux